12 HubSpot Dashboard Examples for Sales Teams
Explore 12 HubSpot sales dashboard examples that help you track performance, align your team, and turn real-time data into smarter sales strategies.
Putting all that hard work into building and implementing a sales process is one thing. But knowing whether it’s working (or whether all that work was actually worth the effort) is another.
Fortunately, not only is HubSpot a fantastic CRM, it’s also a reporting powerhouse. Whether you’re managing a team of reps or want to track your individual performance, HubSpot has reporting tools and dashboards to help you pinpoint what’s working and what’s not.
And that means a smarter and more efficient sales process for your team to follow. But with that power also comes an intimidating tool if you’re not a data junkie.
That’s why we’ve curated our 12 favorite HubSpot dashboards to help sales leaders, managers, and reps measure performance, streamline their sales processes, and crush their quotas.
Why use HubSpot Sales dashboards?
Do you really need to go through the effort of figuring out HubSpot’s massive library of reporting tools? Can’t you just get by with Google Sheets?
If you want to end up wasting more time than you’d save, sure. But top-performing sales teams know how to use performance data to their advantage, and that’s exactly what HubSpot equips you to do.
Top sales teams use HubSpot dashboards to create a centralized hub that visually tracks all of their metrics and KPIs so that they can make data-driven decisions. Powered by every datapoint in your CRM, these dashboards can help steer you in the right direction.
Here are a few specific reasons that I find HubSpot dashboards are well worth the effort to create:
- They empower you to monitor sales performance by tracking revenue, pipeline activity, and forecasted revenue.
- They allow you to gather insights from multiple data sources by integrating HubSpot with various tools for broader visibility.
- You can drive sales strategy faster by using sales analytics and key metrics to guide your decisions rather than relying on guesswork.
You can align sales and marketing teams by merging CRM and marketing data for a holistic view.
How to create a sales dashboard in HubSpot [Step by step]
While HubSpot’s reporting tools can be intimidating, it’s incredibly easy to create a dashboard.
Where most teams get overwhelmed is the options you have for reports (both in choosing pre-built reports or building custom reports yourself). Here’s how to build your first dashboard in HubSpot:
- Log in to your HubSpot portal
- Head to Reporting > Dashboards
- Click Create dashboard.
- Select a pre-built template from the dashboard library or start with a blank dashboard to build your own.
- Name your dashboard and define access permissions. Choose who can view or edit it to ensure only the right people can collaborate while sensitive data stays protected.
- Add reports that display the key metrics and performance indicators you want to track. Use the drag-and-drop editor to arrange your widgets.
- Save and publish your dashboard.
Don’t worry, you can always update or refine your dashboards later as your needs change. Starting from scratch can be intimidating, so check out my 12 favorite sales dashboards below for some inspiration (and time savings).
12 HubSpot Dashboard Examples to Track Your Sales Performance
You’re here to save time, not learn the ins and outs of HubSpot’s reporting tools.
Here are my 12 favorite sales dashboards in HubSpot:
- High-level sales performance
- Sales activities
- Deal performance
- For sales reps
- For sales managers
- Target accounts overview
- LinkedIn performance and insights
- Sales conversion rate
- Sales pipeline performance
- Customer retention
- Revenue attribution
- Team performance
Read on for screenshots and examples of each one!
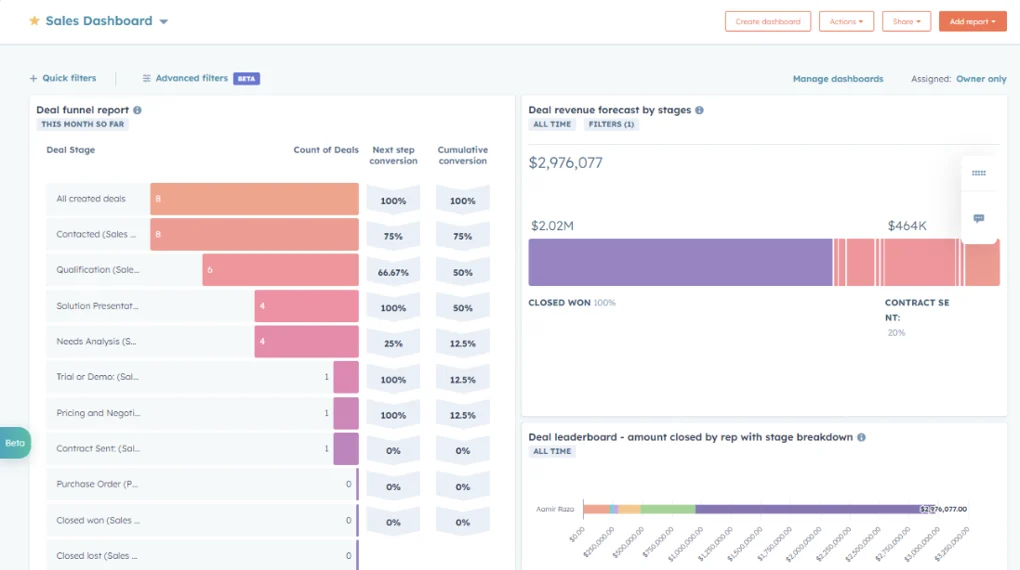
1. Sales Performance Dashboard
If you’re brand new to HubSpot’s reports, then the all-purpose sales dashboard is a great place to start.
Think of this dashboard as the heart of your sales analytics strategy. The sales performance dashboard provides a high-level view of how your sales efforts are translating into results. It tracks overall performance with key sales metrics like:
- Closed deals
- Revenue generated
- Conversion rates
- Deal stages

I like using this dashboard to monitor how a team is progressing toward sales targets and identify where to focus coaching efforts.
Tip: Segment your dashboard by lead status or lifecycle stage to spot gaps in your sales process and prioritize coaching.
2. Sales Activities Dashboard
Let’s drill down deeper into the nuts and bolts of what your team is actually doing day-to-day.
The sales activity dashboard lets you track and evaluate your sales reps' output by recording every action they take. That means you can track the number of:
- Calls made
- Emails sent
- Meetings booked
- Tasks completed
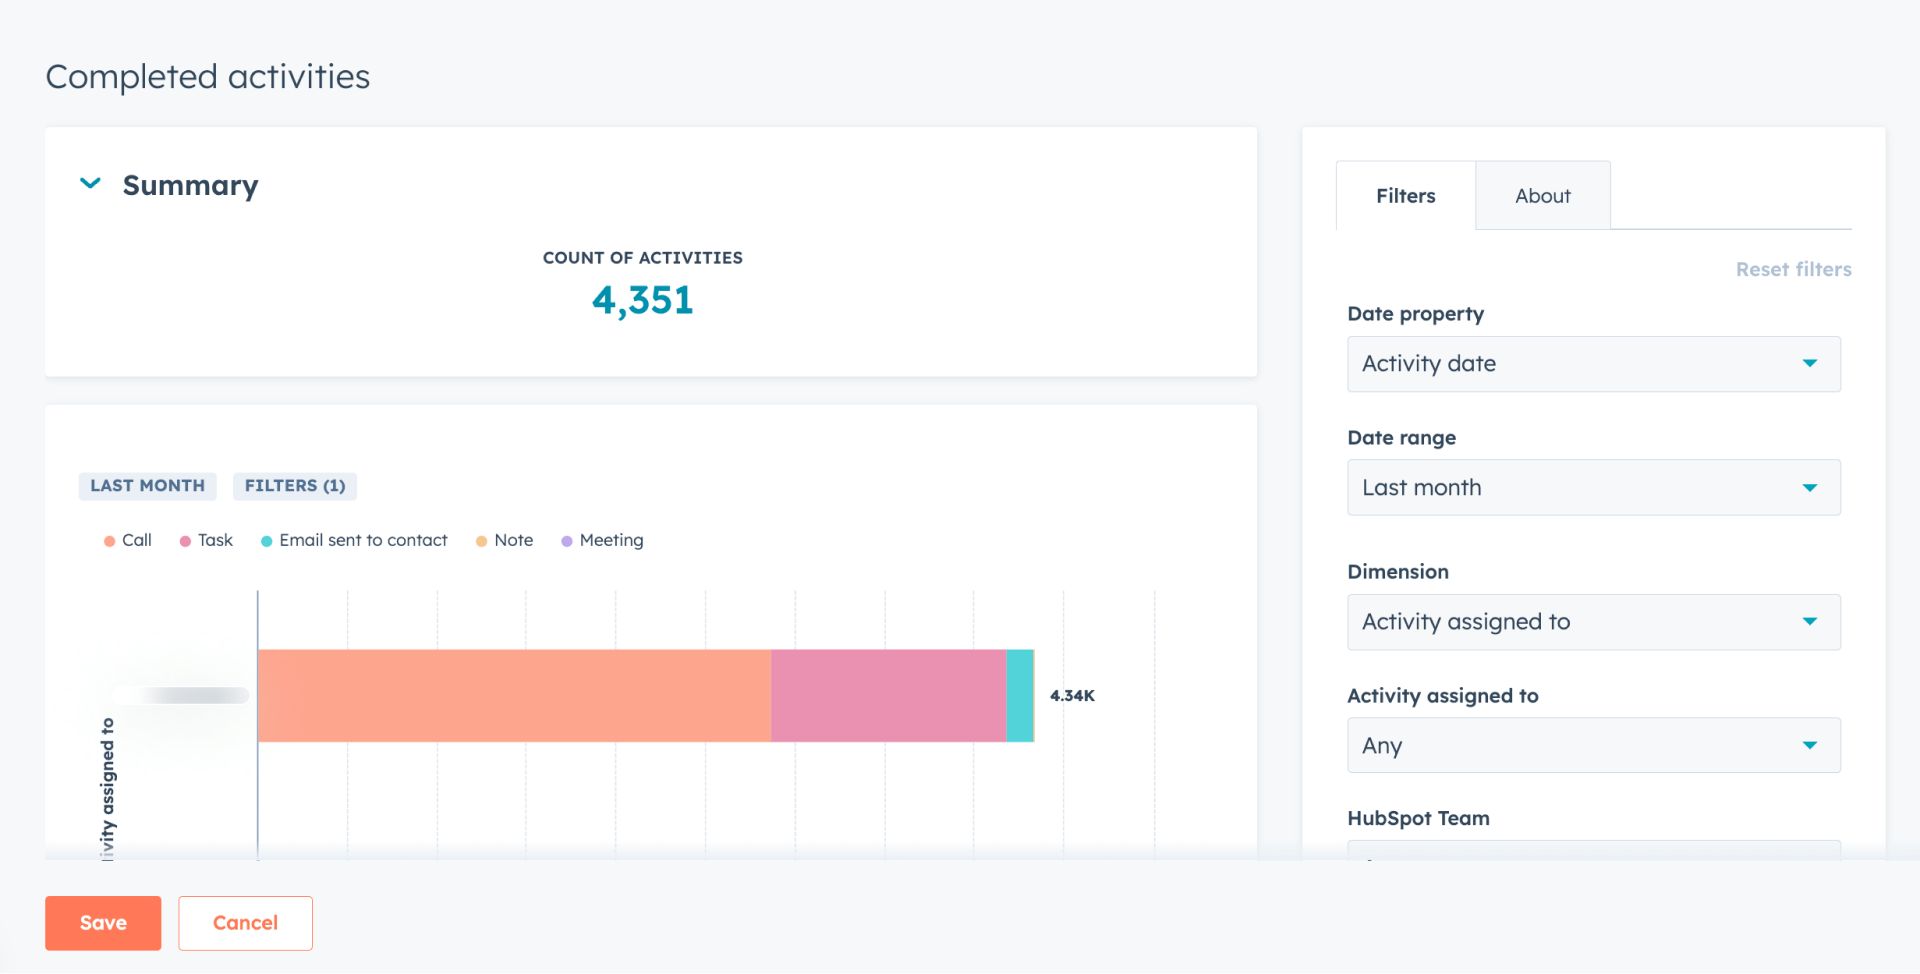
I like to use this dashboard to keep reps (and myself!) accountable. Tracking activities this way also helps sales leadership know what is going on and spot trends.
Tip: Track completed activities to benchmark against top performers and forecast deal flow.
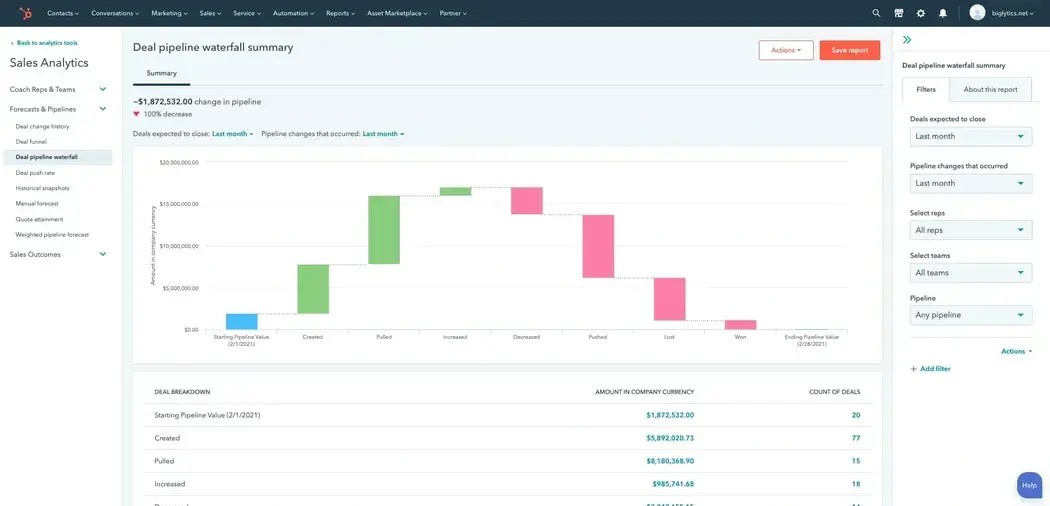
3. Deal Performance Dashboard
For the last of our “high-level” dashboards, I like to keep an eye on deal performance as well.
Top sales teams know that pipeline management is essential, so this dashboard makes it easy to see how many deals are in flight and at what stage they are. With the HubSpot deal performance dashboard, you can track:
- How many deals are in progress
- Forecasted revenue
- Deal progression by stage
- Win/loss ratio
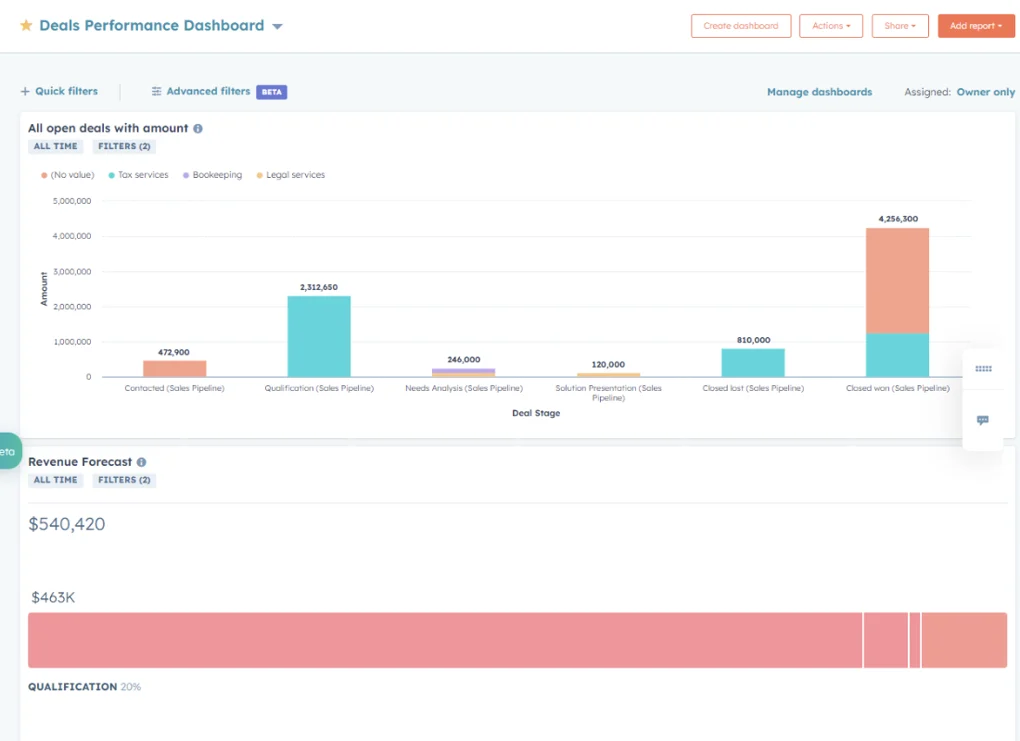
This dashboard is perfect for analyzing pipeline health and identifying slow-moving opportunities in your sales funnel. HubSpot’s reporting tools can be a bit limiting here, so if you want to go deeper into deal performance and movement, you can try a tool like Zebra BI.
4. Sales Rep Dashboard
So far, we’ve been looking at sales activity from a high level.
Sales managers need to dig into specific reps, either to praise top-performers or motivate underperformers. By using the sales rep dashboard in HubSpot, reps (and managers) can get insights into individual performance by tracking:
- Monthly progress towards quota
- The number of deals in the pipeline
- Calls made and emails sent
- LinkedIn connections sent
- Revenue closed

I recommend using this dashboard as a motivational tool and a way to personalize training for each based on actual performance data.
For example, if you notice that a rep’s pipeline is moving slowly, work with them on follow-up and setting next steps for prospects. Or if you see a rep making fewer calls, investigate why and work with them on setting dedicated time blocks for calling.

Ready to fix your outbound process?
5. Sales Manager Dashboard
Tracking individual reps is helpful, but I prefer this sales manager dashboard for a holistic view of the entire team. This helps managers easily identify top performers and underperformers, and understand how the team is progressing toward its goals.
This dashboard gives leadership a bird's-eye view of a team, tracking things like:
- Team quotas
- Today’s stats
- Revenue vs. target
- Meetings held
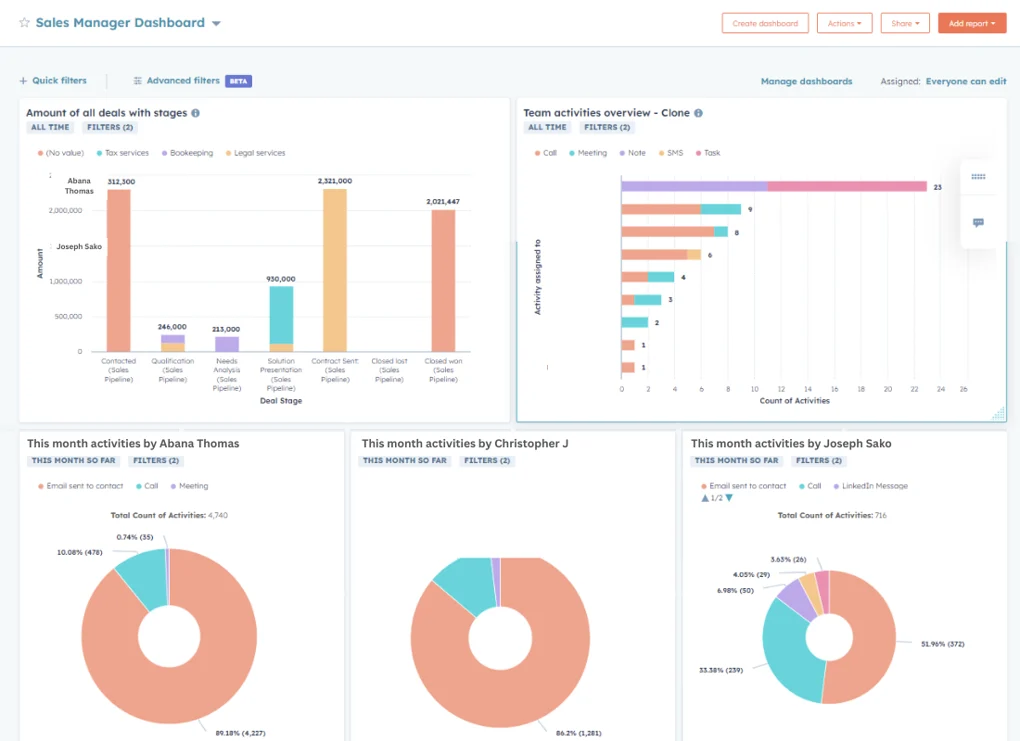
I recommend using this dashboard to support weekly one-on-ones with reps, set expectations, and track progress toward broader sales goals.
6. Target Accounts Overview
Let’s get strategic. The best sales reps I’ve ever known can rattle off statistics about their target accounts, like their birthdays or phone numbers. I used to think it was magic, but now I know it’s just good reporting.
Smart sales reps use target account overview dashboards to gain a clear view of their most valuable accounts for account-based strategies (either account-based marketing or account-based selling). You only have so much time in one day, so you must prioritize accounts that are more engaged and more likely to close. This dashboard helps with that, including metrics like:
- Number of target accounts
- Average deal size
- Lead score
- Account lifecycle stage
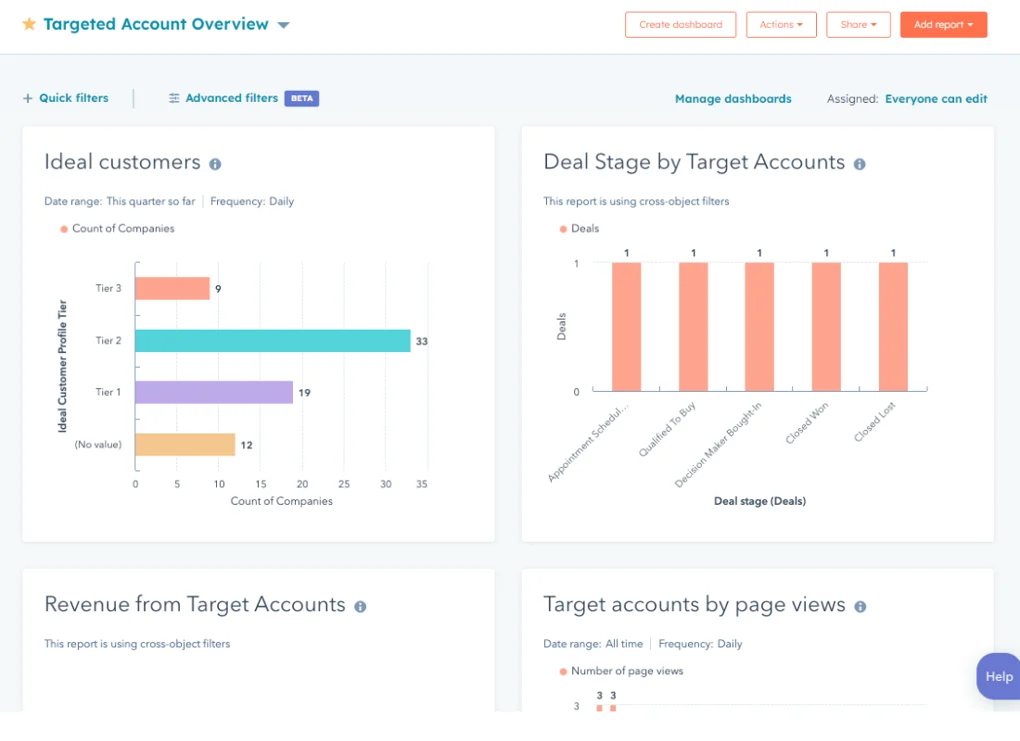
I find this dashboard is handy for account-based strategies by helping you identify accounts that are lagging in the pipeline and need a boost from your sales team.
Tip: Add lead scoring criteria to help prioritize target accounts and focus your sales team’s efforts.
7. LinkedIn Performance Insights Dashboard
Is your team investing in social selling? You absolutely can (and must) track those activities in HubSpot.
By connecting LinkedIn with HubSpot, you can track all kinds of metrics like:
- Number of contacts created from LinkedIn or LinkedIn Sales Navigator
- Weekly or monthly invitations sent and accepted
- LinkedIn messages sent, received, and pending
- Engagement by contact or account

This dashboard is ideal for outbound sales teams leveraging LinkedIn, allowing them to optimize messaging and monitor performance directly within HubSpot. We built Hublead for this purpose: to sync LinkedIn activities to HubSpot and allow you to report on your LinkedIn outbound strategy.
If your team uses LinkedIn for prospecting, Hublead will be an essential part of your prospecting toolkit. You can import leads, enrich contacts, sync messages, and so much more! Sales reps save 10+ hours every month thanks to Hublead; try Hublead for free and see how much time you save this week.
Tip: Create workflows triggered by LinkedIn activity (e.g., accepted connection) to update deal stages or create tasks.
8. Sales Conversion Rate Dashboard
If you want to get into the nitty-gritty of your sales funnel, I love tracking deal movement with this sales conversion rate dashboard. This dashboard reveals where your process is strong and where prospects drop off:
- Lead-to-customer conversion rate
- Opportunity-to-deal rate
- Funnel analysis
Tracking deal movement and conversion rates with this dashboard lets you identify drop-off points and fine-tune how your team converts leads into paying customers.
9. Sales Pipeline Dashboard
Want a high-level visual of your pipeline in one place? Track deals and pipeline activity with the sales pipeline dashboard. I like to include metrics like:
- Deal stage breakdown
- Pipeline coverage
- Deal velocity
I recommend using this dashboard to monitor how fast deals are moving and use sales forecasts to prioritize follow-ups.
10. Customer Retention Dashboard
Sales isn’t just about closing.
Well, maybe not always. If your team covers customer success, enablement, and sales, you need to keep a close eye on customer retention as well. I like to track the following in a customer retention dashboard in HubSpot:
- Churn rate
- Customer lifetime value
- Retention campaigns
On the sales side, this also helps to evaluate whether you’re bringing in and closing good-fit opportunities. If you find that churn is especially high, it might be your prospecting and not the product.
Tip: Segment by industry or persona to see which customer profiles are more likely to renew
11. Revenue Attribution Dashboard
The beauty of HubSpot lies in how it tracks every single activity your prospects take from the moment they visit your website to the day they close.
Whether someone clicked on a Google Ad years ago or landed on a blog last month, you can track first and last touch attribution in HubSpot (the first and last time a lead visited your website) with ease. If you want an exact figure for which channels drive the most revenue, then track these metrics:
- Revenue by channel
- Sales and marketing data impact
- Conversion sources

The revenue attribution dashboard is great for aligning your sales and marketing teams around what actually works (and your marketing team will thank you for the recognition they get!).
Tip: To improve your Revenue Attribution Dashboard, don’t forget to set up UTM parameters for accurate tracking. UTM parameters allow you to see precisely which page visits led to deal creation.
12. Team Performance Dashboard
And finally, if you want to track your entire team to race the collective output and achievements of your reps, then the team performance dashboard will fit the bill. I like to track the following to get a complete view of a sales team’s movement towards quota:
- Quota attainment
- Sales activities completed
- Team comparison metrics
The sales team performance dashboard is a go-to tool for leadership to assess overall effectiveness and design better training plans.
Tip: Use list segmentation to compare performance between different sales reps or territories.
Still Stumped? Here are three sales reporting best practices
We’ve covered quite a bit so far in this article!
You’ve learned:
- How to create a dashboard in HubSpot
- The different use cases for sales dashboards
- All of the amazing dashboards you can create
If you’re getting a case of “blank page syndrome” from all of the possibilities, take a deep breath and follow these best practices for sales reporting in HubSpot:
To get the most out of your HubSpot sales dashboards, follow these best practices to ensure your data remains clear, actionable, and aligned with your goals:
- Keep it simple: The KISS principle (keep it simple, stupid) applies here. HubSpot dashboards can quickly become complex messes that take hours to sift through. And I’ve yet to meet a sales team with the luxury of time for that. Keep it simple by focusing on a few key performance indicators per dashboard to avoid overwhelming your team.
- Keep things fresh: Out-of-date dashboards are useless for your team. Regularly update your dashboards to make sure they reflect your processes and goals. I also recommend that you perform regular data audits to ensure dashboards reflect real-time data for daily standups, weekly reviews, and monthly planning.
Keep in line with your strategy: This is a complete waste of time if your dashboards and metrics are not aligned with your company's overarching strategy. Take care to align with sales goals by making sure your dashboards support the broader sales strategy and help track progress toward company objectives.
Download the HubSpot Outbound Handbook to build a sales process in HubSpot
HubSpot’s reporting tools are powerful, but power can easily become overwhelming.
I hope this tour through my favorite HubSpot sales dashboards gives you some inspiration for what to track on your sales team. Whether you want to measure progress towards quota, an individual rep’s performance, or customer churn, you can do it all in HubSpot.
Choose one of these dashboards (or a bunch of them) and turn your data into actionable insights. If you really want to level up your sales process in HubSpot, download the free HubSpot Outbound Handbook, our guide to building a scalable and effective outbound process in HubSpot.
Click the button below to get it for free and start scaling your outbound process in HubSpot.
Ready to fix your outbound process?
Frequently Asked Questions
What is the difference between a chart and a dashboard?
Charts / reports display single data points or trends. Dashboards combine multiple charts and reports into one view, offering a complete picture of your sales or marketing performance.
What are the main components of a HubSpot sales dashboard?
A HubSpot sales dashboard typically includes KPIs like closed deals, forecasted revenue, deal stage progression, activity volume, and conversion rates. It also pulls in CRM data from marketing and sales to offer a 360° view of the pipeline, allowing teams to make data-driven decisions in real time.
What makes a sales dashboard effective?
An effective sales dashboard provides real-time visibility into key performance metrics that align with your sales goals. It’s clear, role-specific, and easy to interpret helping teams track progress, identify bottlenecks, and take action fast.
.avif)